chockwise

Airport gate management software for airlines and airports

Find the open gate before they do.

Every gate at every airport we cover: who uses it, how hard it works, and when it sits empty. Gate utilization, turn times and idle gaps from real flight data, for gate planning and allocation, with no cameras to install.

Gate Replay · San Diego (SAN) · a typical weekday
265Airports
10,492Gates mapped
620Airlines seen
1,782,107Flights tracked
2,854,060Insights derived
723,232 turns measured 37,729 tows detected 2,506,633 gate-hours timed 634,872 idle gaps measured 204.2M seats counted
Running totals across every airport we cover, updated Nov 17, 2026. Insights = turns, tows, idle gaps between flights, gate-ownership calls and flights with a seat count, all worked out from the raw flights.

AI-enabled aviation analytics

Your gates, explained by AI. Every week.

Gate data is only useful when someone reads it. The Chockwise AI analyst reads all of it: every turn, tow and empty minute at every gate, for you and for the carrier next door. Then it tells you what changed, why, and what to do next.

?Ask in plain English

“Which American gates at DFW sat empty more than 4 hours on Tuesdays?” Get the answer as a table, a map and a chart, with the flights behind it.

✎Written briefings

A weekly report for each station and hub: turn times, tows, gate changes and new flying, with the cause and the gates it happened at.

↻Gate optimization

The fewest gates your schedule needs, which gates can take which aircraft, and what-if plans for new flying, before the allocation meeting.

Weekly gate briefing · O’Hare (ORD)For an airline’s station operations · sample week
Example

Your average turn at ORD grew by 6 minutes (+12%) this week. Most of it traces to tows, which rose from 159 to 187 a week, concentrated on the L concourse during the 15:00–19:00 bank.

56 minaverage turn +6
187tows this week +28
91%L-gate use, 15:00–19:00
  • New regional flying added 41 departures a week, all assigned to gates L1–L9.
  • K-concourse gates that take the same aircraft sat empty 31% of the same window.
  • Moving 6 of the new departures to K would remove an estimated 20 tows a week.

Would you like to work on strategies to cut tows at L, or rebalance the new flying across K and L?

Build a tow planRebalance gatesShow the flights
Example briefing with illustrative numbers.
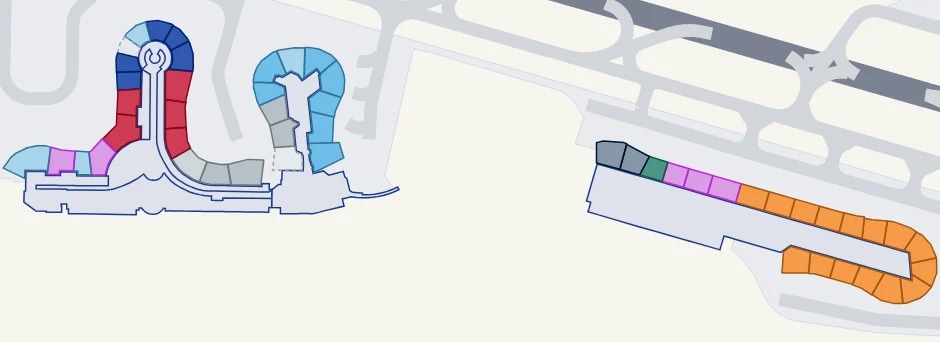
Gate map

Every gate, scored and ranked.

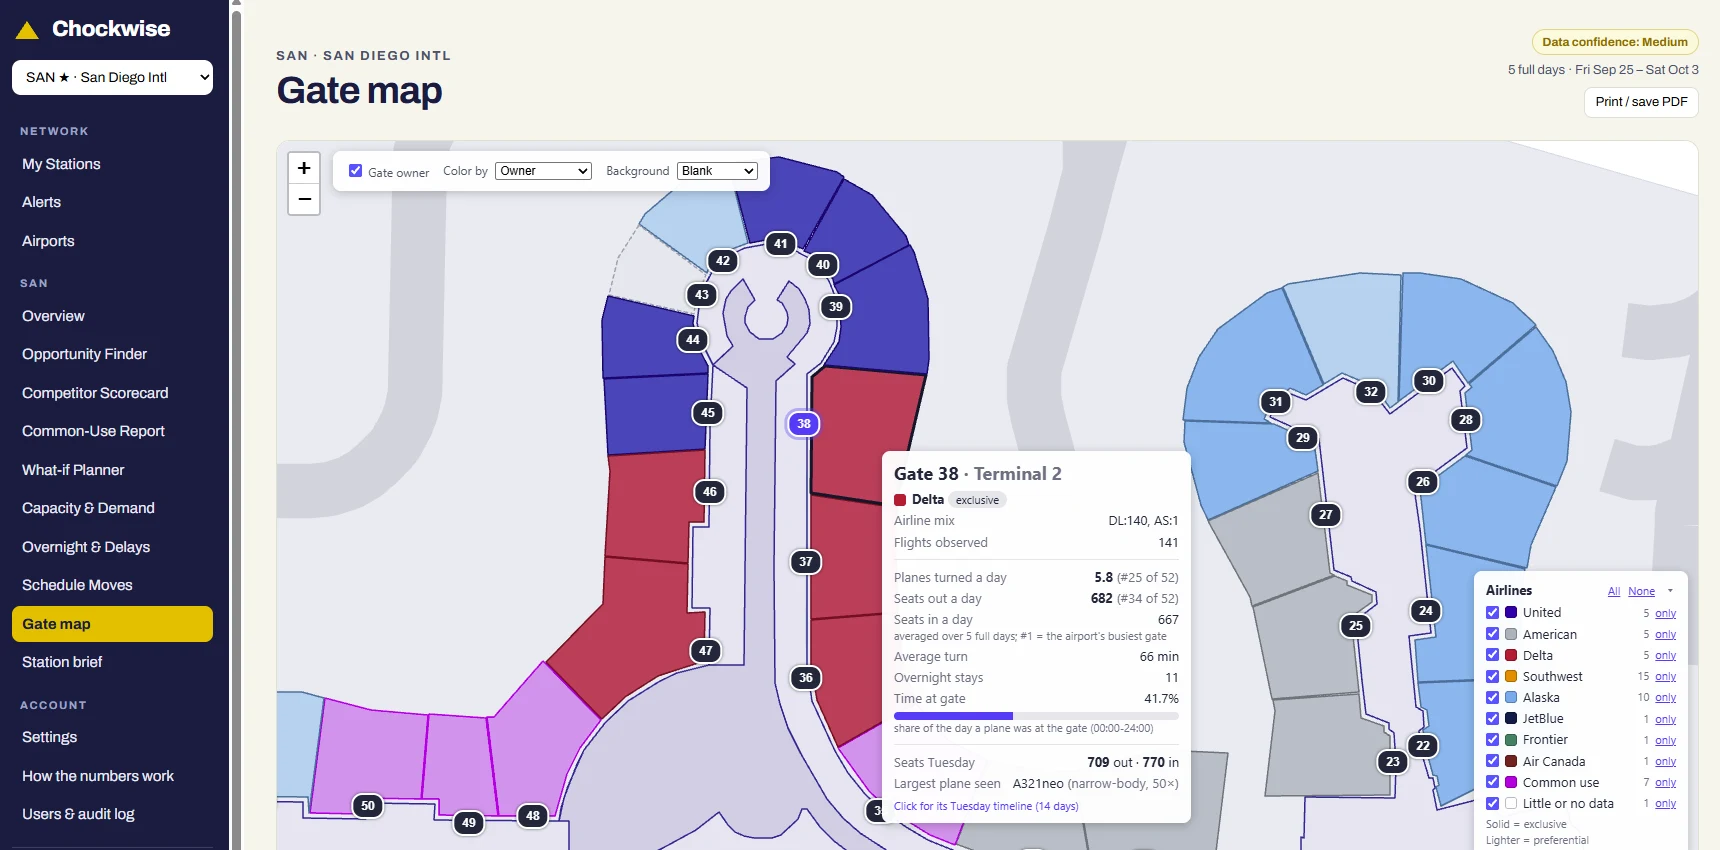
Point at any gate to see the airline that uses it, the airline mix, planes turned and seats out a day, where it ranks at the airport, the average turn, overnight stays and the largest aircraft it has handled. One click opens that gate’s day, minute by minute, for the last 14 days.

Know which gates carry the airport, and which exclusive gates are quietly sitting idle.

The Chockwise gate map at San Diego: Terminal 2 gates colored by the airline that uses each one, with gate 38's card showing Delta exclusive, 5.8 planes turned a day (25th of 52), 682 seats out a day, a 66-minute average turn and 41.7 percent time at the gate.
San Diego, Terminal 2: gate 38 turns 5.8 planes a day and ranks 25th of 52.

Who it is for

Both sides of the gate.

Win the gates you needChockwise for Airlines
Can we add a 787 at 15:00?New Flight
Which shared gate could become ours?Free a Gate
How do our gates compare with theirs?Competitor Scorecard
See everything for airlines
Fill the gates you haveChockwise for Airports
Which airline uses its gates hardest?Airline Scorecard
Who should we offer this gate to?Gate Offer
Where do we run out of gates when flights run late?Delay Risk
See everything for airports

How Chockwise is different

Planning intelligence across airports, not another ops system at one.

Existing airport and airline platforms run the day at a single airport. Chockwise shows how every gate is used across the airports you fly to, yours and your competitors’, with no hardware to install: gate utilization and gate and stand allocation planning, not another system to run the day.

CapabilityExisting airport and airline platformsChockwise
DeploymentCamera installs, AODB/RMS integrations, on-site or heavy IT work, built airport by airportA software and data product only: no cameras or hardware, so it rolls out across many airports quickly
ScopeDeep real-time execution at one airport, or a few, for the operatorCompetitive intelligence across many airports, with a network and station planning view of you and your competitors
Primary usersOps control, ground handlers and day-of-operations teamsNetwork planners, station managers, airport commercial and strategy teams, and ground ops
Core outputsLive timestamps, alerts, predicted off-block times, safety and emissions monitoringA plain-English AI analyst, weekly briefings with recommendations, what-if gate optimization, idle-gap and tow analysis
Cost and rolloutEnterprise contracts with high setup costs, often six figures per airport per year, and rollouts that take months at each airportFast rollout, in days to weeks, with competitive, value-added pricing

Free to explore

Look up any of 265 airports. See every gate and the airline that uses it.

Walk into the gate meeting already knowing the answer.

Request access

Ask what your competitor’s gates are really doing.

We’re adding airports every week and opening the AI analyst to enterprise partners. If you plan the network, run the station, or handle the ground, request access and we’ll be in touch.

Or email info@chockwise.com · follow @chockwise on X

We use your details only to reply to you. Privacy policy